320x100
아...... 이번 챕터는 호흡이 진짜
조오오오올라게 길다......
뭔가 지쳤다. ㅋㅋㅋㅋㅋㅋㅋㅋ
그래도 분명 유의미한 배움들은 있었다.
대표적으로
1. 결측값(NaN)의 활용
2. 중복값(duplicated)의 활용
이었다.
# Intro to NA Values

import pandas as pd
import numpy as np

sales = pd.read_csv('sales.csv', index_col = 0)
sales.head()

'''
Mon	Tue	Wed	Thu	Fri
Steven	34	27	15	NaN	33
Mike	45	9	74	87.0	12
Andi	17	33	54	8.0	29
Paul	87	67	27	45.0	7
'''
sales.info()
'''
<class 'pandas.core.frame.DataFrame'>
Index: 4 entries, Steven to Paul
Data columns (total 5 columns):
# Column Non-Null Count Dtype
--- ------ -------------- -----
0 Mon 4 non-null int64
1 Tue 4 non-null int64
2 Wed 4 non-null int64
3 Thu 3 non-null float64
4 Fri 4 non-null int64
dtypes: float64(1), int64(4)
memory usage: 192.0+ bytes
'''sales.loc['Steven', 'Thu']
# nan# 1,1에 위치한 값을 NaN값으로 변경해주기
sales.iloc[1,1] = Nonesales
'''
Mon Tue Wed Thu Fri
Steven 34 27.0 15 NaN 33
Mike 45 NaN 74 87.0 12
Andi 17 33.0 54 8.0 29
Paul 87 67.0 27 45.0 7
'''# 2,2에 위치한 값을 NaN 으로 만들어주기
sales.iloc[2,2] = np.nansales
'''
Mon Tue Wed Thu Fri
Steven 34 27.0 15.0 NaN 33
Mike 45 NaN 74.0 87.0 12
Andi 17 33.0 NaN 8.0 29
Paul 87 67.0 27.0 45.0 7
'''
# 만약에 들어있는 값이 공백이면 NaN값이 아니라 빈 값으로 나온다.
# 더불어서 공백은 결측값도 아니다.sales.info()
'''
<class 'pandas.core.frame.DataFrame'>
Index: 4 entries, Steven to Paul
Data columns (total 5 columns):
# Column Non-Null Count Dtype
--- ------ -------------- -----
0 Mon 4 non-null int64
1 Tue 3 non-null float64
2 Wed 3 non-null float64
3 Thu 3 non-null float64
4 Fri 4 non-null int64
dtypes: float64(3), int64(2)
memory usage: 364.0+ bytes
'''
# 따라서 공백은 info()로 확인해도 non-null의 위치에 나오게 된다.## Datecting Missing Values
- 결측값 찾아내기
### Titanic Dataset
# 결측값을 찾아내는 순서
# 1 - head혹은 tail등으로 조회
titanic = pd.read_csv('titanic_imp.csv')
titanic.head(10)
'''
Survived Class Gender Age Sipsp Parch Fare Emb Deck
0 0 3 male 22.0 1 0 7.2500 S NaN
1 1 1 female 38.0 1 0 71.2833 C C
2 1 3 female 26.0 0 0 7.9250 S NaN
3 1 1 female 35.0 1 0 53.1000 S C
4 0 3 male 35.0 0 0 8.0500 S NaN
5 0 3 male NaN 0 0 8.4583 Q NaN
6 0 1 male 54.0 0 0 51.8625 S E
7 0 3 male 2.0 3 1 21.0750 S NaN
8 1 3 female 27.0 0 2 11.1333 S NaN
9 1 2 female 14.0 1 0 30.0708 C NaN
'''
# head나 tail등으로 보는 이유는 missing Data라고 해서 값이 없거나
# 공백에 대해서 pandas는 결측치로 보지 않기 때문이다.# 결측값을 찾아내는 순서
# 2 - info()
titanic.info()
'''
<class 'pandas.core.frame.DataFrame'>
RangeIndex: 894 entries, 0 to 893
Data columns (total 9 columns):
# Column Non-Null Count Dtype
--- ------ -------------- -----
0 Survived 894 non-null int64
1 Class 894 non-null int64
2 Gender 894 non-null object
3 Age 717 non-null float64
4 Sipsp 894 non-null int64
5 Parch 894 non-null int64
6 Fare 894 non-null float64
7 Emb 892 non-null object
8 Deck 203 non-null object
dtypes: float64(2), int64(4), object(3)
memory usage: 63.0+ KB
'''# 결측값을 찾아내는 순서
# 3 - isna()로 NaN 값이 있는가?에 대해서
# NaN 값이 있는 필드는 True로 표시
titanic.isna()
'''
Survived Class Gender Age Sipsp Parch Fare Emb Deck
0 False False False False False False False False True
1 False False False False False False False False False
2 False False False False False False False False True
3 False False False False False False False False False
4 False False False False False False False False True
... ... ... ... ... ... ... ... ... ...
889 False False False False False False False False False
890 False False False False False False False False True
891 False False False False False False False False True
892 False False False False False False False False True
893 False False False False False False False False True
894 rows × 9 columns
'''
# 하지만 이렇게 확인하면, 값이 약간만 커도 확인하기 어렵다는 단점이 있다.
# 따라서 다른 내장함수들과 함께 이용해주는 것이 보편적이다.# 결측값을 찾아내는 순서
# 4 - isna()로 NaN 값이 있는가?에 대해서 컬럼기준으로 합쳐주기
# axis = 0일경우 컬럼을 기준으로 한다.
titanic.isna().sum(axis = 0)
'''
Survived 0
Class 0
Gender 0
Age 177
Sipsp 0
Parch 0
Fare 0
Emb 2
Deck 691
dtype: int64
'''# 결측값을 찾아내는 순서
# 5 - isna()로 NaN 값이 있는가?에 대해서 컬럼기준으로 확인하고
# NaN값이 단 한개라도 있으면 True를 리턴한다.
# axis = 0일경우 컬럼을 기준으로 한다.
titanic.isna().any(axis = 0)
'''
Survived False
Class False
Gender False
Age True
Sipsp False
Parch False
Fare False
Emb True
Deck True
dtype: bool
'''# 결측값을 찾아내는 순서
# 6 - isna().any를 응용해서, 해당되는 행들만 출력하기
titanic[titanic.isna().any(axis = 1)]
'''
Survived Class Gender Age Sipsp Parch Fare Emb Deck
0 0 3 male 22.0 1 0 7.2500 S NaN
2 1 3 female 26.0 0 0 7.9250 S NaN
4 0 3 male 35.0 0 0 8.0500 S NaN
5 0 3 male NaN 0 0 8.4583 Q NaN
7 0 3 male 2.0 3 1 21.0750 S NaN
... ... ... ... ... ... ... ... ... ...
888 0 3 female NaN 1 2 23.4500 S NaN
890 0 3 male 32.0 0 0 7.7500 Q NaN
891 0 2 male 24.0 0 0 10.5000 S NaN
892 0 3 male 34.0 1 1 14.4000 S NaN
893 0 3 male 36.0 0 0 7.8958 S NaN
712 rows × 9 columns
'''
# 기존 행의 갯수가 894개라고 앞선 info에서 볼 수가 있었는데
# 712행만 나온다. 즉, 나머지 182 행은 NaN값을 가졌다는 것을 알 수 있다.
# NaN값이 포함된 행을 알 수 있을 뿐 아니라.
# 굳이 구분해주지 않고도 이렇게 응용하여서 NaN값이 나오는 값으로 설정해서 진행하는것도 가능하다.# 결측값을 찾아내는 순서
# 7 - isna()의 반대 notna()
titanic.notna()
'''
Survived Class Gender Age Sipsp Parch Fare Emb Deck
0 True True True True True True True True False
1 True True True True True True True True True
2 True True True True True True True True False
3 True True True True True True True True True
4 True True True True True True True True False
... ... ... ... ... ... ... ... ... ...
889 True True True True True True True True True
890 True True True True True True True True False
891 True True True True True True True True False
892 True True True True True True True True False
893 True True True True True True True True False
894 rows × 9 columns
'''titanic.notna().sum(axis = 0)
'''
Survived 894
Class 894
Gender 894
Age 717
Sipsp 894
Parch 894
Fare 894
Emb 892
Deck 203
dtype: int64
'''titanic.notna().all(axis = 0)
'''
Survived True
Class True
Gender True
Age False
Sipsp True
Parch True
Fare True
Emb False
Deck False
dtype: bool
'''
# False가 있다는 것은 결측값이 있다는 말import matplotlib.pyplot as plt
import seaborn as sns
plt.figure(figsize = (14,10))
sns.heatmap(titanic.notna())
plt.show()
# 이렇게 하면 밝은 색 값이 True, 즉 not-null을 의미하고
# 어두운 색 값이 False, 즉 NaN값을 의미한다.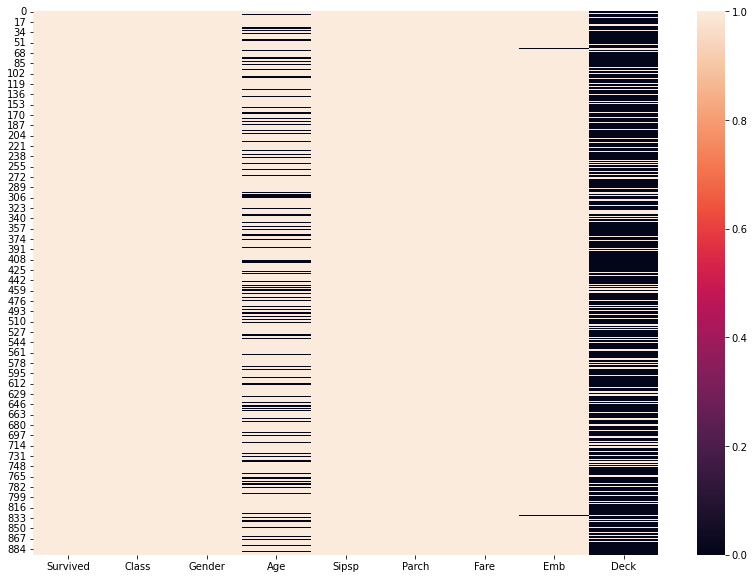
# NaN값을 제외한 나머지 갯수
titanic.Age.value_counts(dropna = True)

'''
24.00    31
22.00    27
18.00    26
19.00    25
28.00    25
         ..
55.50     1
66.00     1
0.92      1
23.50     1
74.00     1
Name: Age, Length: 91, dtype: int64
'''

# 만약 NaN값만 세고 싶다면 dropna = False로 해주면 된다.
# 이전에 Missing Data에 대해서 ''였나, ' '로 전환해주었던 것으로 기억한다.
# 그것은 결측값이 아니므로 np.nan으로 전환해주는 과정을 거친다.
titanic.Age.replace(to_replace = '', value = np.nan, inplace = True)titanic.Age.replace(to_replace = ' ', value = np.nan, inplace = True)titanic.info()
'''
<class 'pandas.core.frame.DataFrame'>
RangeIndex: 894 entries, 0 to 893
Data columns (total 9 columns):
# Column Non-Null Count Dtype
--- ------ -------------- -----
0 Survived 894 non-null int64
1 Class 894 non-null int64
2 Gender 894 non-null object
3 Age 717 non-null float64
4 Sipsp 894 non-null int64
5 Parch 894 non-null int64
6 Fare 894 non-null float64
7 Emb 892 non-null object
8 Deck 203 non-null object
dtypes: float64(2), int64(4), object(3)
memory usage: 63.0+ KB
'''import matplotlib.pyplot as plt
import seaborn as sns
plt.figure(figsize = (14,10))
sns.heatmap(titanic.notna())
plt.show()
# missing data등을 NaN으로 전환해준 후에 다시 확인해보니
# 검은색 바가 더 추가된 것을 볼 수가 있다.
음... Age 컬럼에서 원래는 월등히 검정색 바가 적었는데,
내가 저장 실수를 한 것같다.
아무튼 Age 컬럼의 검정색 바가 압도적으로 많이 늘어났다.
### Olympic Dataset

summer = pd.read_csv('summer_imp.csv')
summer.head()

'''
	Year	City	Sport	Discipline	Athlete_Name	Country	Gender	Event	Medal
0	1896	Athens	Aquatics	Swimming	Hajos, Alfred	HUN	Men	100M Freestyle	Gold
1	1896	Athens	Aquatics	Swimming	Herschmann, Otto	AUT	Men	100M Freestyle	Silver
2	1896	Athens	Aquatics	Swimming	Drivas, Dimitrios	GRE	Men	100M Freestyle For Sailors	Bronze
3	1896	Athens	Aquatics	Swimming	Malokinis, Ioannis	GRE	Men	100M Freestyle For Sailors	Gold
4	1896	Athens	Aquatics	Swimming	Chasapis, Spiridon	GRE	Men	100M Freestyle For Sailors	Silver
'''
summer.info()
'''
<class 'pandas.core.frame.DataFrame'>
RangeIndex: 31170 entries, 0 to 31169
Data columns (total 9 columns):
# Column Non-Null Count Dtype
--- ------ -------------- -----
0 Year 31170 non-null int64
1 City 31170 non-null object
2 Sport 31170 non-null object
3 Discipline 31170 non-null object
4 Athlete_Name 31170 non-null object
5 Country 31166 non-null object
6 Gender 31170 non-null object
7 Event 31170 non-null object
8 Medal 31170 non-null object
dtypes: int64(1), object(8)
memory usage: 2.1+ MB
'''
# Country 컬럼에서 4개의 결측값이 있다는 것을 확인할 수 있다.
# 이것을 출력하기 위해서 다음의 작업을 한다.# 결측값이 있는 행 출력해주기
summer[summer.isna().any(axis = 1)]
'''
Year City Sport Discipline Athlete_Name Country Gender Event Medal
29608 2012 London Athletics Athletics Pending NaN Women 1500M Gold
31077 2012 London Weightlifting Weightlifting Pending NaN Women 63KG Gold
31096 2012 London Weightlifting Weightlifting Pending NaN Men 94KG Silver
31115 2012 London Wrestling Wrestling Freestyle Kudukhov, Besik NaN Men Wf 60 KG Silver
'''## Removing Missing Values with dropna()
### Titanic Dataset
titanic.head()
'''
Survived Class Gender Age Sipsp Parch Fare Emb Deck
0 0 3 male 22.0 1 0 7.2500 S NaN
1 1 1 female 38.0 1 0 71.2833 C C
2 1 3 female 26.0 0 0 7.9250 S NaN
3 1 1 female 35.0 1 0 53.1000 S C
4 0 3 male 35.0 0 0 8.0500 S NaN
'''titanic.info()
'''
<class 'pandas.core.frame.DataFrame'>
RangeIndex: 894 entries, 0 to 893
Data columns (total 9 columns):
# Column Non-Null Count Dtype
--- ------ -------------- -----
0 Survived 894 non-null int64
1 Class 894 non-null int64
2 Gender 894 non-null object
3 Age 717 non-null float64
4 Sipsp 894 non-null int64
5 Parch 894 non-null int64
6 Fare 894 non-null float64
7 Emb 892 non-null object
8 Deck 203 non-null object
dtypes: float64(2), int64(4), object(3)
memory usage: 63.0+ KB
'''titanic.Emb.isna()
'''
0 False
1 False
2 False
3 False
4 False
...
889 False
890 False
891 False
892 False
893 False
Name: Emb, Length: 894, dtype: bool
'''
# 이렇게 나오는걸 보니 titanic[]로 이용하거나 titanic.loc[]로 이용할 수 있다는 것을 알 수 있다.# titanic의 Emb 컬럼중에서 NaN값이 포함되어있는 행을 출력해라.
titanic[titanic.Emb.isna()]
'''
Survived Class Gender Age Sipsp Parch Fare Emb Deck
61 1 1 female 38.0 0 0 80.0 NaN B
829 1 1 female 62.0 0 0 80.0 NaN B
'''titanic.loc[titanic.Emb.isna()]
'''
Survived Class Gender Age Sipsp Parch Fare Emb Deck
61 1 1 female 38.0 0 0 80.0 NaN B
829 1 1 female 62.0 0 0 80.0 NaN B
'''
# 음... 결과값은 loc을 쓰든 안쓰든 똑같은데 왜 굳이 loc을 때로는 붙여주는 걸까?titanic.Age.value_counts(dropna = False)
'''
NaN 177
24.00 31
22.00 27
18.00 26
28.00 25
...
55.50 1
66.00 1
0.92 1
23.50 1
74.00 1
Name: Age, Length: 92, dtype: int64
'''# NaN값이 포함되어있을때 이것을 무시하고 계산해주는 함수
titanic.Age.mean(skipna = True)
# 30.718507670850766# 만약 NaN값이 포함되어있을 때는 계산이 되질 않는다.
titanic.Age.mean(skipna = False)
# nan# 전체 값에 대한 모양
titanic.shape
# (894, 9)# 결측값이 포함된 행을 모두 삭제하고 남은 행에 대한 모양
titanic.dropna().shape
# (182, 9)
# 때문에 이렇게 결측값을 모두 드랍시키고 계산된 값을 가지게 되면 머신러닝등을 할때 신뢰도가 떨어질 수 있다.
# 좀 더 디테일하게 다루는 것이 필요하다.# axis 행을 기준으로
# 아무 NaN이라도 있으면 그 값은 떨군다. 는 의미
titanic.dropna(axis = 0, how = 'any').shape
# (182, 9)# axis 열을 기준으로
# 아무 NaN이라도 있으면, 해당 열은 떨군다는 의미
titanic.dropna(axis = 1, how = 'any').shape
# (894, 6)# axis 행 기준으로
# 해당 행 전체가 결측값이라면 해당 행을 떨궈라.
titanic.dropna(axis = 0, how = 'all').shape
# (894, 9)# axis 열 기준으로
# 해당 열 전체가 결측값이라면 해당 열을 떨궈라.
titanic.dropna(axis = 1, how = 'all').shape
# (894, 9)# axis 행 기준으로
# thresh는 몇개 미만이면
# dropna, 값을 떨궈라. 이런 뜻이다.
titanic.dropna(axis = 0, thresh = 8).shape
# (736, 9)# axis 열 기준으로
# 500개 미만의 값이 NaN에 해당되면 해당 열은 떨궈라.
titanic.dropna(axis = 1, thresh = 500).shape
# (894, 8)
# 1개의 컬럼이 떨궈졌다.titanic.dropna(axis = 1, thresh = 500, inplace=True )titanic.head()
'''
Survived Class Gender Age Sipsp Parch Fare Emb
0 0 3 male 22.0 1 0 7.2500 S
1 1 1 female 38.0 1 0 71.2833 C
2 1 3 female 26.0 0 0 7.9250 S
3 1 1 female 35.0 1 0 53.1000 S
4 0 3 male 35.0 0 0 8.0500 S
'''
# Deck 열은 날라갔다.titanic.shape
# (894, 8)# NaN값이 4개 미만일때는
# 행 기준으로 떨구려고 하는데
# 그 대상은 survived, class, gender, age만을 대상으로 한다.
titanic.dropna(axis = 0, subset = ['Survived', 'Class', 'Gender', 'Age'], thresh = 4).shape
# (717, 8)
# 하나라도 결측값이 있을경우에 누락된다는 말이라고 한다.
# 사실 맞다. 1이든 2든 3이든 4개 미만이 되므로, 1개라도 걸리는게 있으면
# 해당 인덱스를 떨궈주는 것이다.# 위의 기능은 사실 how = 'any'와도 같다.
titanic.dropna(axis = 0, subset = ['Survived', 'Class', 'Gender', 'Age'], how = 'any').shape
# (717, 8)### Olympic Dataset
summer.head()
'''
Year City Sport Discipline Athlete_Name Country Gender Event Medal
0 1896 Athens Aquatics Swimming Hajos, Alfred HUN Men 100M Freestyle Gold
1 1896 Athens Aquatics Swimming Herschmann, Otto AUT Men 100M Freestyle Silver
2 1896 Athens Aquatics Swimming Drivas, Dimitrios GRE Men 100M Freestyle For Sailors Bronze
3 1896 Athens Aquatics Swimming Malokinis, Ioannis GRE Men 100M Freestyle For Sailors Gold
4 1896 Athens Aquatics Swimming Chasapis, Spiridon GRE Men 100M Freestyle For Sailors Silver
'''summer.info()
'''
<class 'pandas.core.frame.DataFrame'>
RangeIndex: 31170 entries, 0 to 31169
Data columns (total 9 columns):
# Column Non-Null Count Dtype
--- ------ -------------- -----
0 Year 31170 non-null int64
1 City 31170 non-null object
2 Sport 31170 non-null object
3 Discipline 31170 non-null object
4 Athlete_Name 31170 non-null object
5 Country 31166 non-null object
6 Gender 31170 non-null object
7 Event 31170 non-null object
8 Medal 31170 non-null object
dtypes: int64(1), object(8)
memory usage: 2.1+ MB
'''
# Country 컬럼에 4개의 결측치가 있다.# 컬럼기준으로 한개라도 결측치가 있는 컬럼을 리턴해라
summer[summer.isna().any(axis = 1)]
'''
Year City Sport Discipline Athlete_Name Country Gender Event Medal
29608 2012 London Athletics Athletics Pending NaN Women 1500M Gold
31077 2012 London Weightlifting Weightlifting Pending NaN Women 63KG Gold
31096 2012 London Weightlifting Weightlifting Pending NaN Men 94KG Silver
31115 2012 London Wrestling Wrestling Freestyle Kudukhov, Besik NaN Men Wf 60 KG Silver
'''# 모든 결측치 값이 들어있는 행에 대해서 드랍을 시키고, 저장한다.
# 왜 행이냐면 기본값이 axis = 0 이기 때문이다.
summer.dropna(inplace = True)
# 결측값이 들어있는 행을 지우는 이유는 3만개가 넘는 값중에서 결측치가 있는 행이 4개인것을 확인했고
# 이 4개의 행은 데이터를 측정하는데 크게 유의미한 차이가 아니라고 판단되었기에 빼주는 과정을 거친것이다.summer.info()
'''
<class 'pandas.core.frame.DataFrame'>
Int64Index: 31166 entries, 0 to 31169
Data columns (total 9 columns):
# Column Non-Null Count Dtype
--- ------ -------------- -----
0 Year 31166 non-null int64
1 City 31166 non-null object
2 Sport 31166 non-null object
3 Discipline 31166 non-null object
4 Athlete_Name 31166 non-null object
5 Country 31166 non-null object
6 Gender 31166 non-null object
7 Event 31166 non-null object
8 Medal 31166 non-null object
dtypes: int64(1), object(8)
memory usage: 2.4+ MB
'''## Replacing Missing Values with fillna()
### Titanic Dataset

titanic.head()

'''
    Survived	Class	Gender	Age	Sipsp	Parch	Fare	Emb
0	0	3	male	22.0	1	0	7.2500	S
1	1	1	female	38.0	1	0	71.2833	C
2	1	3	female	26.0	0	0	7.9250	S
3	1	1	female	35.0	1	0	53.1000	S
4	0	3	male	35.0	0	0	8.0500	S
'''
titanic.info()
'''
<class 'pandas.core.frame.DataFrame'>
RangeIndex: 894 entries, 0 to 893
Data columns (total 8 columns):
# Column Non-Null Count Dtype
--- ------ -------------- -----
0 Survived 894 non-null int64
1 Class 894 non-null int64
2 Gender 894 non-null object
3 Age 717 non-null float64
4 Sipsp 894 non-null int64
5 Parch 894 non-null int64
6 Fare 894 non-null float64
7 Emb 892 non-null object
dtypes: float64(2), int64(4), object(2)
memory usage: 56.0+ KB
'''# Age의 평균 값이고
titanic.Age.mean()
# 30.718507670850766# Age의 평균값을 변수화 해준다.
mean = round(titanic.Age.mean(),1)
mean
# 30.7# Age 중에서 NaN값이 있으면, 해당 값은 위에서 구한 Age의 평균값으로 대체하고 저장해준다.
titanic.Age.fillna(mean,inplace = True)
# NaN값 다른 값으로 채워넣어주기titanic.head(6)
'''
Survived Class Gender Age Sipsp Parch Fare Emb
0 0 3 male 22.0 1 0 7.2500 S
1 1 1 female 38.0 1 0 71.2833 C
2 1 3 female 26.0 0 0 7.9250 S
3 1 1 female 35.0 1 0 53.1000 S
4 0 3 male 35.0 0 0 8.0500 S
5 0 3 male 30.7 0 0 8.4583 Q
'''
# 이처럼 NaN값에 무엇을 채워줘야할지 모를때는 평균값 혹은 중앙값을 채워넣어준다고 한다.
# 음.. 그런데 원래 평균값이나 중앙값을 가지고 있던 거는 그러면 어떻게 되는거지..
# 의미측면에서 말이다.
# 어느 데이터나 더 의미를 가지는 값이 있다면 그것으로 전체적으로 변경해주면 좋을것같다고 말씀하셨다.titanic.info()
'''
<class 'pandas.core.frame.DataFrame'>
RangeIndex: 894 entries, 0 to 893
Data columns (total 8 columns):
# Column Non-Null Count Dtype
--- ------ -------------- -----
0 Survived 894 non-null int64
1 Class 894 non-null int64
2 Gender 894 non-null object
3 Age 894 non-null float64
4 Sipsp 894 non-null int64
5 Parch 894 non-null int64
6 Fare 894 non-null float64
7 Emb 892 non-null object
dtypes: float64(2), int64(4), object(2)
memory usage: 56.0+ KB
'''## Detection of Duplicates
# 컬럼 명을 Alphabet으로 설정
alphabet = pd.DataFrame(['a', 'b','c','c','d','e','f', 'g', 'g', 'g'], columns = ['Alphabet'])
alphabet
'''
Alphabet
0 a
1 b
2 c
3 c
4 d
5 e
6 f
7 g
8 g
9 g
'''# duplicated는 중복값을 찾아주는 것이다.
# keep 값에 무엇을 넣느냐에 따라서 정말 다양한 활용이 가능하다.
# 1 - False의 경우 - 중복값을 모두 True로 리턴한다.
alphabet.duplicated(keep = False)
'''
0 False
1 False
2 True
3 True
4 False
5 False
6 False
7 True
8 True
9 True
dtype: bool
'''# 2 - 'first'인경우 - 중복값중 첫번째는 False로 리턴하고 두번째 중복값부터 True로 리턴한다.
# 예컨데, c, c이렇게 있으면 False, True / d,d,d 이렇게 있으면 False, True, True
alphabet.duplicated(keep = 'first')
'''
0 False
1 False
2 False
3 True
4 False
5 False
6 False
7 False
8 True
9 True
dtype: bool
'''# 3 - 'last'인경우 - 중복값중 마지막 값만 False로 리턴하고 나머지는 True로 리턴한다.
# 예컨데, c, c이렇게 있으면 True, False / d,d,d 이렇게 있으면 True, True, False
alphabet.duplicated(keep = 'last')
'''
0 False
1 False
2 True
3 False
4 False
5 False
6 False
7 True
8 True
9 False
dtype: bool
'''alphabet[alphabet.duplicated(keep = False)]
'''
Alphabet
2 c
3 c
7 g
8 g
9 g
'''### Titanic Dataset
titanic.head()
'''
Survived Class Gender Age Sipsp Parch Fare Emb
0 0 3 male 22.0 1 0 7.2500 S
1 1 1 female 38.0 1 0 71.2833 C
2 1 3 female 26.0 0 0 7.9250 S
3 1 1 female 35.0 1 0 53.1000 S
4 0 3 male 35.0 0 0 8.0500 S
'''titanic.info()
'''
<class 'pandas.core.frame.DataFrame'>
RangeIndex: 894 entries, 0 to 893
Data columns (total 8 columns):
# Column Non-Null Count Dtype
--- ------ -------------- -----
0 Survived 894 non-null int64
1 Class 894 non-null int64
2 Gender 894 non-null object
3 Age 894 non-null float64
4 Sipsp 894 non-null int64
5 Parch 894 non-null int64
6 Fare 894 non-null float64
7 Emb 892 non-null object
dtypes: float64(2), int64(4), object(2)
memory usage: 56.0+ KB
'''# 중복값이 있는만큼 내가 필요로 하는 데이터 프레임보다 더 불필요하게 있다고 받아들이면 된다고 한다.
# 중복 값중에서 처음 나온 값을 제외하고 나머지 중복값 (중복값 중에서도 a,a,a 중복과 / b,b,b 중복은 다르다.)
titanic.duplicated(keep = 'first').sum()
# 114
# 이것은 잠재적인 중복값이므로 좀 더 분석이 더 필요하다.
# keep에 'first'를 넣어주는 것으로 값을 세는것은 타당하다고 보인다.
# 왜냐하면 중복값이 2개인것도 있고 4개인것도 있을텐데
# 처음 중복값이든 마지막 중복값이든 배제하고 카운트하면, 불필요하게 포함되어있는 중복값에 대해서 제거 하는게 가능하기 때문이다.
# 그리고 전체 중복으로 하게되면 무리가 있을것같다. 생존은 0과 1인데 0과 1은 중복이 다량으로 나올 수 밖에 없기 때문이다.
# 그런데 또 보면 first 중복값으로써 첫번째 중복값이 배제된 값이 114면 도대체 뭔 기준으로 중복을 다루는거지?
# 완전일치?
# 그것을 확인하기 위해 다음의 실행문을 실행해보자titanic[titanic.duplicated(keep = 'first')]
'''
Survived Class Gender Age Sipsp Parch Fare Emb
47 1 3 female 30.7 0 0 7.7500 Q
76 0 3 male 30.7 0 0 7.8958 S
77 0 3 male 30.7 0 0 8.0500 S
87 0 3 male 30.7 0 0 8.0500 S
95 0 3 male 30.7 0 0 8.0500 S
... ... ... ... ... ... ... ... ...
884 0 3 male 25.0 0 0 7.0500 S
886 0 2 male 27.0 0 0 13.0000 S
891 0 2 male 24.0 0 0 10.5000 S
892 0 3 male 34.0 1 1 14.4000 S
893 0 3 male 36.0 0 0 7.8958 S
114 rows × 8 columns
'''
# 확실히 중복값이 많은것으로 보인다.
# 즉, duplicated의 기능은 행 기준으로 봤을때 (설정에 따라 열기준도 가능)
# 행이 가지고 있는 각 컬럼의 값이 완전히 일치해야 True가 리턴되는것같다.
# 그건 그렇고 생존, 객실, 성벌, 나이, 티켓표값 등등이 완전히 일치하지 않을 확률은 얼마나 될까?
# 이게 정말 유의미한 수준의 중복값이라고 할 수 있을까?### Olympic Dataset
summer.head()
'''
Year City Sport Discipline Athlete_Name Country Gender Event Medal
0 1896 Athens Aquatics Swimming Hajos, Alfred HUN Men 100M Freestyle Gold
1 1896 Athens Aquatics Swimming Herschmann, Otto AUT Men 100M Freestyle Silver
2 1896 Athens Aquatics Swimming Drivas, Dimitrios GRE Men 100M Freestyle For Sailors Bronze
3 1896 Athens Aquatics Swimming Malokinis, Ioannis GRE Men 100M Freestyle For Sailors Gold
4 1896 Athens Aquatics Swimming Chasapis, Spiridon GRE Men 100M Freestyle For Sailors Silver
'''
# 여기는 값의 생김새를 보아하니, 유의미한 중복값을 찾아내기 충분할 것 같다.summer.info()
'''
<class 'pandas.core.frame.DataFrame'>
Int64Index: 31166 entries, 0 to 31169
Data columns (total 9 columns):
# Column Non-Null Count Dtype
--- ------ -------------- -----
0 Year 31166 non-null int64
1 City 31166 non-null object
2 Sport 31166 non-null object
3 Discipline 31166 non-null object
4 Athlete_Name 31166 non-null object
5 Country 31166 non-null object
6 Gender 31166 non-null object
7 Event 31166 non-null object
8 Medal 31166 non-null object
dtypes: int64(1), object(8)
memory usage: 2.4+ MB
'''summer.duplicated(keep = 'first').sum()
# 7
# 유의미한 중복값이 7개라고 보인다.summer[summer.duplicated(keep = False)]
'''
Year City Sport Discipline Athlete_Name Country Gender Event Medal
2068 1912 Stockholm Athletics Athletics Lelong, Charles Louis FRA Men 4X400M Relay Silver
2069 1912 Stockholm Athletics Athletics Lelong, Charles Louis FRA Men 4X400M Relay Silver
12252 1968 Mexico Fencing Fencing Kalmar, Janos HUN Men Sabre Team Bronze
12253 1968 Mexico Fencing Fencing Kalmar, Janos HUN Men Sabre Team Bronze
15595 1980 Moscow Boxing Boxing Mustafov, Ismail BUL Men - 48KG (Light-Flyweight) Bronze
15596 1980 Moscow Boxing Boxing Mustafov, Ismail BUL Men - 48KG (Light-Flyweight) Bronze
16101 1980 Moscow Hockey Hockey Singh, Singh IND Men Hockey Gold
16102 1980 Moscow Hockey Hockey Singh, Singh IND Men Hockey Gold
21832 1996 Atlanta Baseball Baseball Scull, Antonio CUB Men Baseball Gold
21833 1996 Atlanta Baseball Baseball Scull, Antonio CUB Men Baseball Gold
28677 2008 Beijing Rowing Rowing Volpenhein, Bryan USA Men Eight With Coxswain (8+) Bronze
28678 2008 Beijing Rowing Rowing Volpenhein, Bryan USA Men Eight With Coxswain (8+) Bronze
29784 2012 London Badminton Badminton Zhao, Yunlei CHN Women Doubles Gold
29790 2012 London Badminton Badminton Zhao, Yunlei CHN Women Doubles Gold
'''# 2012년에 농구로 얻어낸 고유한 메달들을 확인하기 위한 조회
summer[(summer.Sport == 'Basketball') & (summer.Year == 2012)]
'''
Year City Sport Discipline Athlete_Name Country Gender Event Medal
29801 2012 London Basketball Basketball Anthony, Carmelo USA Men Basketball Gold
29802 2012 London Basketball Basketball Bryant, Kobe USA Men Basketball Gold
29803 2012 London Basketball Basketball Chandler, Tyson USA Men Basketball Gold
29804 2012 London Basketball Basketball Davis, Anthony USA Men Basketball Gold
29805 2012 London Basketball Basketball Durant, Kevin USA Men Basketball Gold
... ... ... ... ... ... ... ... ... ...
29868 2012 London Basketball Basketball Macleod, Kathleen AUS Women Basketball Bronze
29869 2012 London Basketball Basketball Ohea, Jenna AUS Women Basketball Bronze
29870 2012 London Basketball Basketball Richards, Samantha AUS Women Basketball Bronze
29871 2012 London Basketball Basketball Screen, Jennifer AUS Women Basketball Bronze
29872 2012 London Basketball Basketball Snell, Belinda AUS Women Basketball Bronze
72 rows × 9 columns
'''## Handling / Removing Duplicates
### Titanic Dataset
titanic.tail()
'''
Survived Class Gender Age Sipsp Parch Fare Emb
889 1 1 male 26.0 0 0 30.0000 C
890 0 3 male 32.0 0 0 7.7500 Q
891 0 2 male 24.0 0 0 10.5000 S
892 0 3 male 34.0 1 1 14.4000 S
893 0 3 male 36.0 0 0 7.8958 S
'''titanic.duplicated().sum()
# 114titanic[titanic.duplicated()]
'''
Survived Class Gender Age Sipsp Parch Fare Emb
47 1 3 female 30.7 0 0 7.7500 Q
76 0 3 male 30.7 0 0 7.8958 S
77 0 3 male 30.7 0 0 8.0500 S
87 0 3 male 30.7 0 0 8.0500 S
95 0 3 male 30.7 0 0 8.0500 S
... ... ... ... ... ... ... ... ...
884 0 3 male 25.0 0 0 7.0500 S
886 0 2 male 27.0 0 0 13.0000 S
891 0 2 male 24.0 0 0 10.5000 S
892 0 3 male 34.0 1 1 14.4000 S
893 0 3 male 36.0 0 0 7.8958 S
114 rows × 8 columns
'''titanic.drop(index = [891,892,893], inplace = True)titanic.tail()
'''
Survived Class Gender Age Sipsp Parch Fare Emb
886 0 2 male 27.0 0 0 13.00 S
887 1 1 female 19.0 0 0 30.00 S
888 0 3 female 30.7 1 2 23.45 S
889 1 1 male 26.0 0 0 30.00 C
890 0 3 male 32.0 0 0 7.75 Q
'''titanic.info()
'''
<class 'pandas.core.frame.DataFrame'>
RangeIndex: 891 entries, 0 to 890
Data columns (total 8 columns):
# Column Non-Null Count Dtype
--- ------ -------------- -----
0 Survived 891 non-null int64
1 Class 891 non-null int64
2 Gender 891 non-null object
3 Age 891 non-null float64
4 Sipsp 891 non-null int64
5 Parch 891 non-null int64
6 Fare 891 non-null float64
7 Emb 889 non-null object
dtypes: float64(2), int64(4), object(2)
memory usage: 55.8+ KB
'''### Olympic Dataset
summer.head()
'''
Year City Sport Discipline Athlete_Name Country Gender Event Medal
0 1896 Athens Aquatics Swimming Hajos, Alfred HUN Men 100M Freestyle Gold
1 1896 Athens Aquatics Swimming Herschmann, Otto AUT Men 100M Freestyle Silver
2 1896 Athens Aquatics Swimming Drivas, Dimitrios GRE Men 100M Freestyle For Sailors Bronze
3 1896 Athens Aquatics Swimming Malokinis, Ioannis GRE Men 100M Freestyle For Sailors Gold
4 1896 Athens Aquatics Swimming Chasapis, Spiridon GRE Men 100M Freestyle For Sailors Silver
'''summer[summer.duplicated(keep = False)]
# 전체 중복값
'''
Year City Sport Discipline Athlete_Name Country Gender Event Medal
2068 1912 Stockholm Athletics Athletics Lelong, Charles Louis FRA Men 4X400M Relay Silver
2069 1912 Stockholm Athletics Athletics Lelong, Charles Louis FRA Men 4X400M Relay Silver
12252 1968 Mexico Fencing Fencing Kalmar, Janos HUN Men Sabre Team Bronze
12253 1968 Mexico Fencing Fencing Kalmar, Janos HUN Men Sabre Team Bronze
15595 1980 Moscow Boxing Boxing Mustafov, Ismail BUL Men - 48KG (Light-Flyweight) Bronze
15596 1980 Moscow Boxing Boxing Mustafov, Ismail BUL Men - 48KG (Light-Flyweight) Bronze
16101 1980 Moscow Hockey Hockey Singh, Singh IND Men Hockey Gold
16102 1980 Moscow Hockey Hockey Singh, Singh IND Men Hockey Gold
21832 1996 Atlanta Baseball Baseball Scull, Antonio CUB Men Baseball Gold
21833 1996 Atlanta Baseball Baseball Scull, Antonio CUB Men Baseball Gold
28677 2008 Beijing Rowing Rowing Volpenhein, Bryan USA Men Eight With Coxswain (8+) Bronze
28678 2008 Beijing Rowing Rowing Volpenhein, Bryan USA Men Eight With Coxswain (8+) Bronze
29784 2012 London Badminton Badminton Zhao, Yunlei CHN Women Doubles Gold
29790 2012 London Badminton Badminton Zhao, Yunlei CHN Women Doubles Gold
'''# 이게 될거라 생각했는데, 역시 불린은 인덱스 값과 다르구나.
# 불린으로 이턴된 인덱스값을 리턴하려면 어떻게 하지?
# summer.drop(index = (summer.duplicated(keep = 'first')))
summer.drop(index = [2069,12253,15596,21833,28678], inplace = True)
# 불린값을 인덱스로 전환하자면, 불린값을 리턴하는 수식의 가장 마지막에 .index를 하면 되고
# 이에 대해서는 좀 더 내리면 예시가 나온다.summer[summer.duplicated(keep = False)]alphabet[alphabet.duplicated(keep = False)]
'''
Alphabet
2 c
3 c
7 g
8 g
9 g
'''# 사실상 변수.duplicated(keep = 'first')를 값으로 준것처럼 첫번째 값을 제외하고 나머지 중복값들을 제거한다.
alphabet.drop_duplicates(inplace = True)alphabet
'''
Alphabet
0 a
1 b
2 c
4 d
5 e
6 f
7 g
'''
# 보면 알겠지만 중복값은 삭제되었다.
# 반면, 인덱스 값에 대한 정렬은 되질 않은 상태니
# 이를 정리해주는 것도 필요하다.## The ignore_index parameter (NEW in pandas 1.0)
import pandas as pd
alphabet = pd.DataFrame(['a', 'b', 'c', 'c', 'd', 'e', 'f', 'g', 'g', 'g'], columns = ['Alphabet'])
alphabet# 간단하게 drop이 되는게 있었네;
# 이걸 적용하고자 한다면 오버라이딩이나 inplace = True를 해줘야할것같다.
alphabet.drop_duplicates()
'''
Alphabet
0 a
1 b
2 c
4 d
5 e
6 f
7 g
'''
# 그리고 삭제가 되면서 비어있는 인덱스들이 있다.
# 이것을 위해서 ignore_index = True를 넣어준다.alphabet.drop_duplicates().info()
'''
<class 'pandas.core.frame.DataFrame'>
Int64Index: 7 entries, 0 to 7
Data columns (total 1 columns):
# Column Non-Null Count Dtype
--- ------ -------------- -----
0 Alphabet 7 non-null object
dtypes: object(1)
memory usage: 112.0+ bytes
'''alphabet.drop_duplicates(ignore_index = True)
'''
Alphabet
0 a
1 b
2 c
3 d
4 e
5 f
6 g
'''## Detection of Outliers
- 극단값 찾기
titanic.head()
'''
Survived Class Gender Age Sipsp Parch Fare Emb
0 0 3 male 22.0 1 0 7.2500 S
1 1 1 female 38.0 1 0 71.2833 C
2 1 3 female 26.0 0 0 7.9250 S
3 1 1 female 35.0 1 0 53.1000 S
4 0 3 male 35.0 0 0 8.0500 S
'''titanic.describe()
'''
Survived Class Age Sipsp Parch Fare
count 891.000000 891.000000 891.000000 891.000000 891.000000 891.000000
mean 0.383838 2.308642 30.712761 0.523008 0.381594 32.204208
std 0.486592 0.836071 21.588838 1.102743 0.806057 49.693429
min 0.000000 1.000000 0.420000 0.000000 0.000000 0.000000
25% 0.000000 2.000000 22.000000 0.000000 0.000000 7.910400
50% 0.000000 3.000000 30.700000 0.000000 0.000000 14.454200
75% 1.000000 3.000000 35.000000 1.000000 0.000000 31.000000
max 1.000000 3.000000 490.000000 8.000000 6.000000 512.329200
'''
# 다른값은 그렇다쳐도 max age의 값이 490이라는 것은 너무 이상측정값이다.# 위에서 확인한 이상측정값을 보기 위해 그래프를 만들어주자.
plt.figure(figsize = (14,10))
titanic.boxplot('Age')
plt.show()
# 확인해봤을때, 200이 넘어가는 수치가 2개 있다.
# 추가로 확인하기 위해서 선형 그래프를 만들어준다.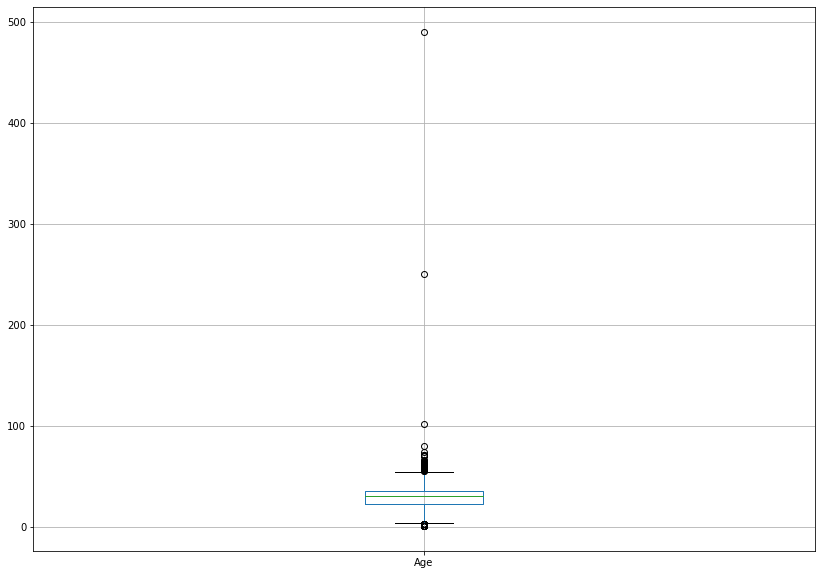
100에서 0구간에 밀집되어있고
200과 300사이에 이상치 1개
400과 500 사이에 이상치 1개가 있음을 확인 할 수 있다.
plt.figure(figsize = (14,10))
titanic.Age.plot()
plt.show()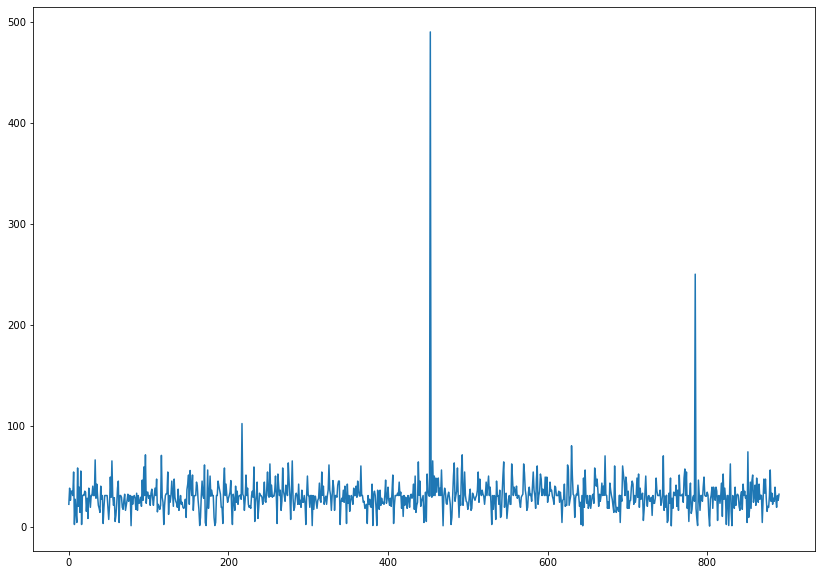
# 높은값 부터 순차적으로 출력
titanic.Age.sort_values(ascending = False)

'''
453    490.00
785    250.00
217    102.00
630     80.00
851     74.00
        ...
831      0.83
469      0.75
644      0.75
755      0.67
803      0.42
Name: Age, Length: 891, dtype: float64
'''
# Age 컬럼에 대해서 90초과인 경우만 출력하는 필터
titanic.loc[titanic.Age > 90]
'''
Survived Class Gender Age Sipsp Parch Fare Emb
217 0 2 male 102.0 1 0 27.0000 S
453 1 1 male 490.0 1 0 89.1042 C
785 0 3 male 250.0 0 0 7.2500 S
'''titanic.Fare.sort_values(ascending= False)
'''
258 512.3292
737 512.3292
679 512.3292
88 263.0000
27 263.0000
...
633 0.0000
413 0.0000
822 0.0000
732 0.0000
674 0.0000
Name: Fare, Length: 891, dtype: float64
'''plt.figure(figsize = (14,10))
titanic.Fare.plot()
plt.show()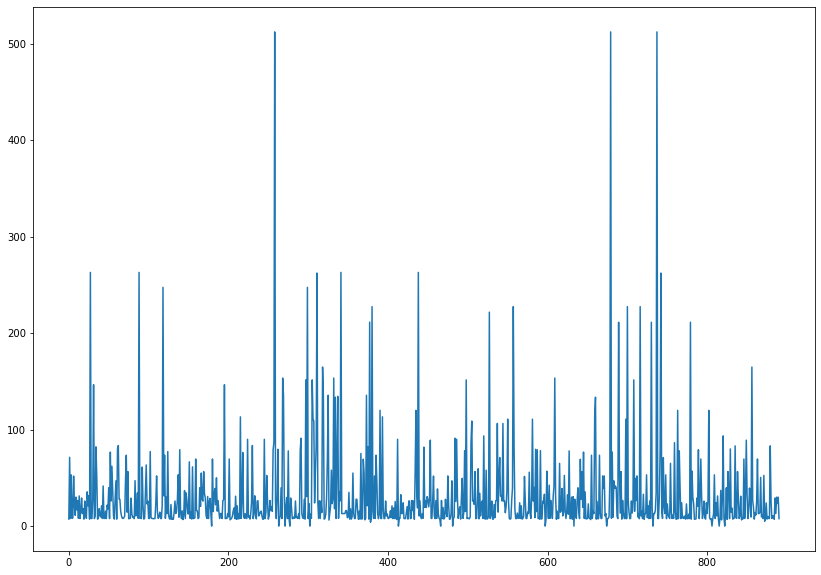
## Handling / Removing Outliers
### Titanic Dataset

# 극단값을 컨트롤 해줘야하는 이유는, 머신러닝을 했을때 결과적으로 신뢰할 수 없는 결과물을 만든다.

titanic.head()

'''
    Survived	Class	Gender	Age	Sipsp	Parch	Fare	Emb
0	0	3	male	22.0	1	0	7.2500	S
1	1	1	female	38.0	1	0	71.2833	C
2	1	3	female	26.0	0	0	7.9250	S
3	1	1	female	35.0	1	0	53.1000	S
4	0	3	male	35.0	0	0	8.0500	S
'''
titanic.loc[titanic.Age > 90]
'''
Survived Class Gender Age Sipsp Parch Fare Emb
217 0 2 male 102.0 1 0 27.0000 S
453 1 1 male 490.0 1 0 89.1042 C
785 0 3 male 250.0 0 0 7.2500 S
'''# **** 매우 중요 ****
# 불리언 인덱스
# 불리언 타입을 인덱스로 전환하는 방법
index_out1 = titanic[titanic.Age > 90].index
index_out1
# Int64Index([217, 453, 785], dtype='int64')# 극단값이 102, 490, 250 살이다.
# 이것을 소수점이 잘못찍힌것으로 가정하고 10을 나누어서 재편성해주도록 한다.
titanic.loc[titanic.Age > 90, 'Age'] = titanic.loc[titanic.Age > 90, 'Age']/10titanic.loc[index_out1]
'''
Survived Class Gender Age Sipsp Parch Fare Emb
217 0 2 male 10.2 1 0 27.0000 S
453 1 1 male 49.0 1 0 89.1042 C
785 0 3 male 25.0 0 0 7.2500 S
'''titanic.loc[217]
'''
Survived 0
Class 2
Gender male
Age 10.2
Sipsp 1
Parch 0
Fare 27.0
Emb S
Name: 217, dtype: object
'''# 행 인덱스값, 컬럼값
# 기존값은 10.2였다.
titanic.loc[217, 'Age'] = 42.0titanic.loc[index_out1]
'''
Survived Class Gender Age Sipsp Parch Fare Emb
217 0 2 male 42.0 1 0 27.0000 S
453 1 1 male 49.0 1 0 89.1042 C
785 0 3 male 25.0 0 0 7.2500 S
'''plt.figure(figsize = (14,10))
titanic.Age.plot()
plt.show()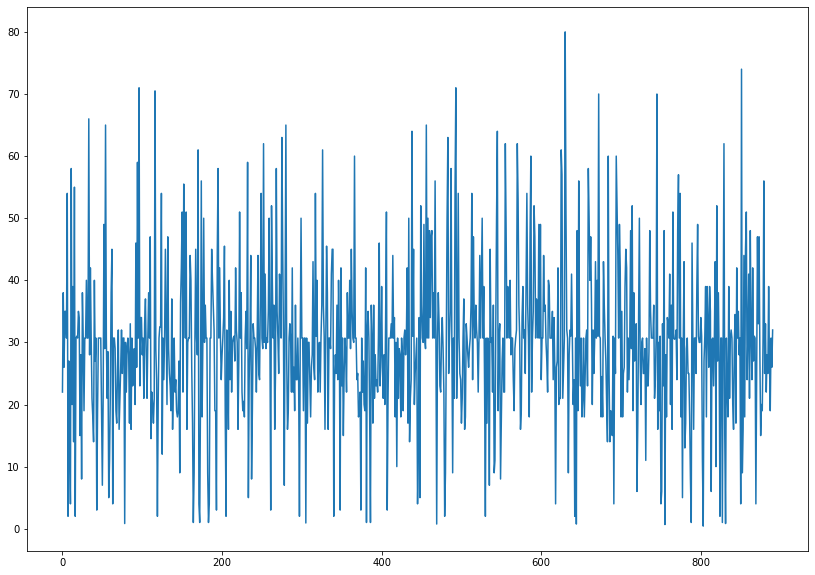
이제서야 비로소 균일하게 정리가 되었음을 확인할 수 있다.
## Categorical Data

# 자주 변경을 하기전에 우선은 세이브 포인트를 지정하는게 좋다.
titanic.to_csv('titanic_clean.csv', index = False)

titanic.nunique()

'''
Survived      2
Class         3
Gender        2
Age          89
Sipsp         7
Parch         7
Fare        248
Emb           3
dtype: int64
'''
titanic[['Gender', 'Emb']].describe()
'''
Gender Emb
count 891 889
unique 2 3
top male S
freq 577 644
'''titanic.Gender = titanic.Gender.astype('category')titanic.Emb = titanic.Emb.astype('category')titanic.info()
'''
<class 'pandas.core.frame.DataFrame'>
RangeIndex: 891 entries, 0 to 890
Data columns (total 8 columns):
# Column Non-Null Count Dtype
--- ------ -------------- -----
0 Survived 891 non-null int64
1 Class 891 non-null int64
2 Gender 891 non-null category
3 Age 891 non-null float64
4 Sipsp 891 non-null int64
5 Parch 891 non-null int64
6 Fare 891 non-null float64
7 Emb 889 non-null category
dtypes: category(2), float64(2), int64(4)
memory usage: 43.9 KB
'''
# astype으로 데이터 타입을 변경해주는것 만으로도 메모리를 아낄 수 있다고 한다.
# 내가 어떻게 변경했는지는 모르겠지만 현재 나의 titanic.info()로써 확인한 메모리 용량은 강사님의 1/2수준이다.titanic.Gender.dtype
# CategoricalDtype(categories=['female', 'male'], ordered=False)## Olympic Dataset
summer.head()
'''
Year City Sport Discipline Athlete_Name Country Gender Event Medal
0 1896 Athens Aquatics Swimming Hajos, Alfred HUN Men 100M Freestyle Gold
1 1896 Athens Aquatics Swimming Herschmann, Otto AUT Men 100M Freestyle Silver
2 1896 Athens Aquatics Swimming Drivas, Dimitrios GRE Men 100M Freestyle For Sailors Bronze
3 1896 Athens Aquatics Swimming Malokinis, Ioannis GRE Men 100M Freestyle For Sailors Gold
4 1896 Athens Aquatics Swimming Chasapis, Spiridon GRE Men 100M Freestyle For Sailors Silver
'''summer.info()
'''
<class 'pandas.core.frame.DataFrame'>
Int64Index: 31161 entries, 0 to 31169
Data columns (total 9 columns):
# Column Non-Null Count Dtype
--- ------ -------------- -----
0 Year 31161 non-null int64
1 City 31161 non-null object
2 Sport 31161 non-null object
3 Discipline 31161 non-null object
4 Athlete_Name 31161 non-null object
5 Country 31161 non-null object
6 Gender 31161 non-null object
7 Event 31161 non-null object
8 Medal 31161 non-null object
dtypes: int64(1), object(8)
memory usage: 2.4+ MB
'''
# 이것도 메모리량이 적다.summer.to_csv('summer_clean.csv', index = False)import pandas as pd
summer = pd.read_csv('summer_clean.csv')
summer.describe(include = ['O'])
'''
City Sport Discipline Athlete_Name Country Gender Event Medal
count 31161 31161 31161 31161 31161 31161 31161 31161
unique 22 43 67 22760 147 2 666 3
top London Aquatics Athletics Phelps, Michael USA Men Football Gold
freq 3563 4170 3637 22 4585 22744 1497 10484
'''
# describe(include = ['O'])는 object의 약어로써
# object 형태의 컬럼을 확인해줘라는 말이다.
# 즉, numeric 타입의 컬럼은 조회가 되지 않는다.summer.nunique()
'''
Year 27
City 22
Sport 43
Discipline 67
Athlete_Name 22760
Country 147
Gender 2
Event 666
Medal 3
dtype: int64
'''# Athlete_Name은 그렇다 치더라도 특히 Event 컬럼의 중복값이 많기 때문에
# 데이터 타입을 category형으로 해준다고 한다.
# 왜그럴까?
# 적합한 열을 범주형태로 변환했다면 그룹처리해서 연산하는게 빨라진다고는 한다.
summer.City = summer.City.astype('category')summer.Sport = summer.Sport.astype('category')summer.Discipline = summer.Discipline.astype('category')summer.Country = summer.Country.astype('category')summer.Gender = summer.Gender.astype('category')summer.Medal = summer.Medal.astype('category')summer.info()
'''
<class 'pandas.core.frame.DataFrame'>
RangeIndex: 31161 entries, 0 to 31160
Data columns (total 9 columns):
# Column Non-Null Count Dtype
--- ------ -------------- -----
0 Year 31161 non-null int64
1 City 31161 non-null category
2 Sport 31161 non-null category
3 Discipline 31161 non-null category
4 Athlete_Name 31161 non-null object
5 Country 31161 non-null category
6 Gender 31161 non-null category
7 Event 31161 non-null object
8 Medal 31161 non-null category
dtypes: category(6), int64(1), object(2)
memory usage: 953.6+ KB
'''### Pandas Version 1.0: NEW Dtypes and pd.NA
import pandas as pd
titanic = pd.read_csv('titanic.csv')
titanic
'''
survived pclass sex age sibsp parch fare embarked deck
0 0 3 male 22.0 1 0 7.2500 S NaN
1 1 1 female 38.0 1 0 71.2833 C C
2 1 3 female 26.0 0 0 7.9250 S NaN
3 1 1 female 35.0 1 0 53.1000 S C
4 0 3 male 35.0 0 0 8.0500 S NaN
... ... ... ... ... ... ... ... ... ...
886 0 2 male 27.0 0 0 13.0000 S NaN
887 1 1 female 19.0 0 0 30.0000 S B
888 0 3 female NaN 1 2 23.4500 S NaN
889 1 1 male 26.0 0 0 30.0000 C C
890 0 3 male 32.0 0 0 7.7500 Q NaN
891 rows × 9 columns
'''titanic.info()
'''
<class 'pandas.core.frame.DataFrame'>
RangeIndex: 891 entries, 0 to 890
Data columns (total 9 columns):
# Column Non-Null Count Dtype
--- ------ -------------- -----
0 survived 891 non-null int64
1 pclass 891 non-null int64
2 sex 891 non-null object
3 age 714 non-null float64
4 sibsp 891 non-null int64
5 parch 891 non-null int64
6 fare 891 non-null float64
7 embarked 889 non-null object
8 deck 203 non-null object
dtypes: float64(2), int64(4), object(3)
memory usage: 62.8+ KB
'''# info로 확인한 데이터 타입 유형이 문자열 유형이 실제 문자열인지 혼합된 유형인지 알수없다.
# 따라서 convert_dtypes()를 써준다.
titanic = titanic.convert_dtypes()titanic.info()
'''
<class 'pandas.core.frame.DataFrame'>
RangeIndex: 891 entries, 0 to 890
Data columns (total 9 columns):
# Column Non-Null Count Dtype
--- ------ -------------- -----
0 survived 891 non-null Int64
1 pclass 891 non-null Int64
2 sex 891 non-null string
3 age 714 non-null Float64
4 sibsp 891 non-null Int64
5 parch 891 non-null Int64
6 fare 891 non-null Float64
7 embarked 889 non-null string
8 deck 203 non-null string
dtypes: Float64(2), Int64(4), string(3)
memory usage: 68.0 KB
'''
정말... 길고 길었다.
너무 호흡이 길어서 뭔가 집중도 더 안되었던 것 같다.
하지만 정말 유용한 섹션음은 틀림없다.
판다스 모든 섹션을 통틀어서 가장 중요한 섹션 중 하나였다고 생각한다.
300x250
'개발일지 > Pandas' 카테고리의 다른 글
| pandas 판다스 기초 18 merge, join, fillna, drop (0) | 2022.08.08 |
|---|---|
| pandas 판다스 틀린부분 복기 7 데이터 정리하기 (0) | 2022.08.01 |
| pandas 판다스 문자열 가공 혼자서 해보기 (0) | 2022.07.28 |
| 매우중요 pandas 판다스 기초 16 문자열 가공 Cleaning Data (0) | 2022.07.28 |
| pandas 판다스 기초 15 Importing Data From Web Site (0) | 2022.07.28 |