320x100
갈 수록 분명 모르는게 점점 많아지기도하고, 줄어들기도 하는 것은 사실이다.
하지만 약간은 좀 더 기계적으로 학습하려고 한다.
생각도 기계적으로 감정을 좀 더 빼고, 학습도 기계적으로.
그리고 점점 나아지고 있는 모습을 보니 참 뿌듯 하다.
# 문제 1 Transform the mpg column in way that the relationship with the horsepower feature is linear/closer to linear!
# Visualize before and after!

# 해당문제는 이해를 못하겠다.
cars

'''
	mpg	cylinders	displacement	horsepower	weight	acceleration	model_year	origin	name
0	18.0	8	307.0	130.0	3504	12.0	1970	usa	chevrolet chevelle malibu
1	15.0	8	350.0	165.0	3693	11.5	1970	usa	buick skylark 320
2	18.0	8	318.0	150.0	3436	11.0	1970	usa	plymouth satellite
3	16.0	8	304.0	150.0	3433	12.0	1970	usa	amc rebel sst
4	17.0	8	302.0	140.0	3449	10.5	1970	usa	ford torino
...	...	...	...	...	...	...	...	...	...
393	27.0	4	140.0	86.0	2790	15.6	1982	usa	ford mustang gl
394	44.0	4	97.0	52.0	2130	24.6	1982	europe	vw pickup
395	32.0	4	135.0	84.0	2295	11.6	1982	usa	dodge rampage
396	28.0	4	120.0	79.0	2625	18.6	1982	usa	ford ranger
397	31.0	4	119.0	82.0	2720	19.4	1982	usa	chevrolet s-10
398 rows × 9 columns
'''
import matplotlib.pyplot as plt
cars.plot(kind = 'scatter', x = 'horsepower', y = 'mpg', figsize = (14,10), fontsize = 14)
plt.show()
cars['gpm'] = (1/cars.mpg*100).round(2)cars.head()
'''
mpg cylinders displacement horsepower weight acceleration model_year origin name gpm
0 18.0 8 307.0 130.0 3504 12.0 1970 usa chevrolet chevelle malibu 5.56
1 15.0 8 350.0 165.0 3693 11.5 1970 usa buick skylark 320 6.67
2 18.0 8 318.0 150.0 3436 11.0 1970 usa plymouth satellite 5.56
3 16.0 8 304.0 150.0 3433 12.0 1970 usa amc rebel sst 6.25
4 17.0 8 302.0 140.0 3449 10.5 1970 usa ford torino 5.88
'''cars.plot(kind = 'scatter', x = 'horsepower', y = 'gpm', figsize = (14,10), fontsize = 14)
plt.show()
# 문제2 Create a new column with the manufacturer name!

# 컬럼을 새로 만드는것 자체는 문제가 아닌데,
# 뭘 어떻게 만들라는건지; 기준도 말해주지 않고 만들라는게 난해하다.
# 힌트도 난해하고

cars['manufacturer'] = cars.name.str.split(' ', n = 1, expand = True)[0]

# 아, 제조사를 구하라는 거구나;
# 세부적으로 쪼개보기
cars.name.str.split(' ')
'''
0 [chevrolet, chevelle, malibu]
1 [buick, skylark, 320]
2 [plymouth, satellite]
3 [amc, rebel, sst]
4 [ford, torino]
...
393 [ford, mustang, gl]
394 [vw, pickup]
395 [dodge, rampage]
396 [ford, ranger]
397 [chevrolet, s-10]
Name: name, Length: 398, dtype: object
'''# 빈칸을 기준으로 1번만 분할해줘라.
# = 나머지는 한개로 합쳐줘라.
cars.name.str.split(' ', n=1)
'''
0 [chevrolet, chevelle malibu]
1 [buick, skylark 320]
2 [plymouth, satellite]
3 [amc, rebel sst]
4 [ford, torino]
...
393 [ford, mustang gl]
394 [vw, pickup]
395 [dodge, rampage]
396 [ford, ranger]
397 [chevrolet, s-10]
Name: name, Length: 398, dtype: object
'''# expand 를 True값으로 놓으면 DataFrame화가 되는 것이고
# False로 놓으면 Series 화가 된다.
cars.name.str.split(' ', n= 1, expand = True)
'''
0 1
0 chevrolet chevelle malibu
1 buick skylark 320
2 plymouth satellite
3 amc rebel sst
4 ford torino
... ... ...
393 ford mustang gl
394 vw pickup
395 dodge rampage
396 ford ranger
397 chevrolet s-10
398 rows × 2 columns
'''cars.name.str.split(' ', n=1, expand = True)[0]
'''
0 chevrolet
1 buick
2 plymouth
3 amc
4 ford
...
393 ford
394 vw
395 dodge
396 ford
397 chevrolet
Name: 0, Length: 398, dtype: object
'''cars.name.str.split(' ', n = 1)[0]
# ['chevrolet', 'chevelle malibu']
# 이처럼 DataFrame화를 시키지 않고 사용하면, 자체로는 사용이 가능하지만
# 이걸 scala 함수라고 그러나?
# 암튼 scala가 아닌 방법으로는 전체적으로 변환하기에는 연산작업이 많아진다.# 문제3 Add a new column with the respective continent (north america, asia, europe)!
# 내코드
import numpy as np
cars['north_america'] = np.nan
cars['asia'] = np.nan
cars['europe'] = np.nan# 내코드
# 내가 잘못 이해했다. 따라서 내가 기존에 만들었던 컬럼은 모두 삭제한다.
cars.drop(columns = ['north_america', 'asia', 'europe'], inplace = True)dic = {'usa':'north_america', 'japan':'asia', 'europe':'europe'}# map이라는 함수가 연계작용을 하는구나..
cars['continent'] = cars.origin.map(dic)# 문제 자체는 최악이라서 뭘 말하는지, 뭘 원하는지도 불분명하지만
# 문제를 풀어가는 루틴이 아주 유용하고 기본적인 dictionary와 map 사용 루틴이라서 아주 기분이 좋다.
cars# 문제4 Visualize and inspect whether there are any extreme values / outliers in the numerical columns that are worth to be capped / floored!
# 내코드
# x축의 요구사항, y축의 요구사항을 안넣었구나.
cars.plot(kind = 'scatter', figsize = (14,10) ,fontsize = 14)
plt.show()
# ValueError: scatter requires an x and y column# 내코드
cars.plot(kind = 'scatter', x = 'model_year', y = 'mpg', hue = 'cars')
# hue값에 무엇을 넣어줘야 전체적인 cars의 컬럼들이 색갈별로 구분될까를 잘 모르겠더라.
# x축과 y축에도 뭘 넣어줘야 전체적인 구조가 잘 나올지 모르겠더라.
# 결국 AttributeError로 마무리 했다.cars.plot(figsize = (14,10), subplots = True)
plt.show()
# 엥... 딱히 x, y는 필수값이 아니였네...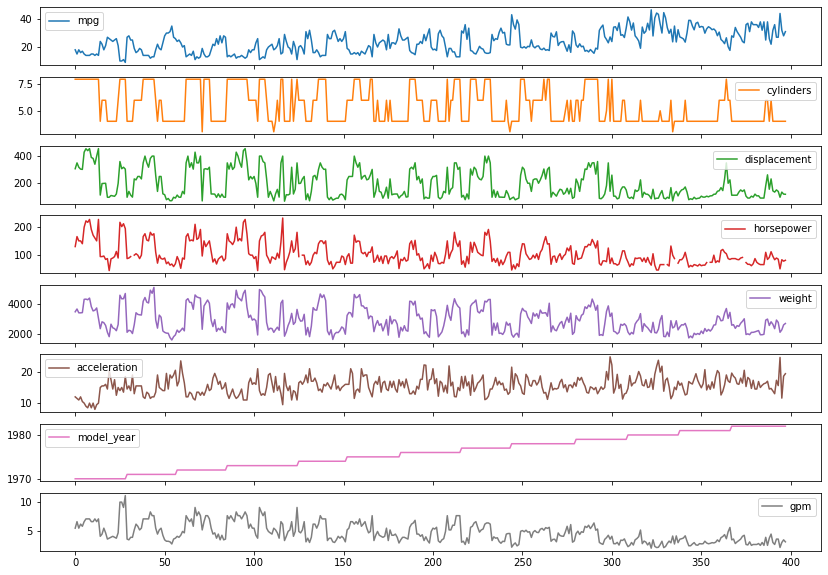
# 문제5 Bin / discretize the weight column! The 25% of cars with the lowest weight shall get the label "light", the 25% of cars with the highest weight shall get the label "heavy" and the remaining 50% the label "medium"! Create a new column "weight_cat"!

# 오... 이거는 비율지정하는 것도 모르겠지만, 그 비율을 Scala 방식으로 접근해서 컬럼 만들어주는것도 아이디어가 안떠오른다.

cars.weight.plot(kind = 'hist')
plt.show()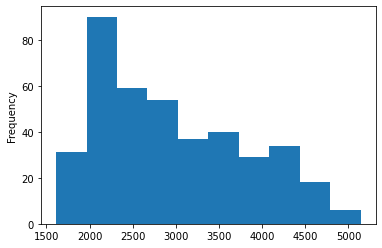
labels = ['light', 'medium', 'heavy']

area = [0, 0.25, 0.75, 1]
# qcut이 뭔기능이였더라.
pd.qcut(cars.weight, q = area, labels = labels).value_counts()
# qcut도, cut도 근본적으로는 이산형함수를 위한 구간나누기 함수같다.
# 다만 활용 방법이 약간 달라서 갈라지는 것같다.
'''
medium 198
light 100
heavy 100
Name: weight, dtype: int64
'''# 실질적 입력이 안됨
# cars.weight_cat = pd.qcut(cars.weight, q = area, labels = labels)
# 실질적 입력이 됨.
cars['weight_cat'] = pd.qcut(cars.weight, q = area, labels = labels)# 문제6 Bring the columns horsepower and the column that you created in question 133 (transformed mpg column) to the same scale by calculating z-scores! Visualize before and after!
# 이건 기본적으로 문제에서 뭔소릴 하는건지 잘 이해를 못하겠다.
cars.loc[:, ['horsepower', 'gpm']].plot(figsize = (14,10))
plt.show()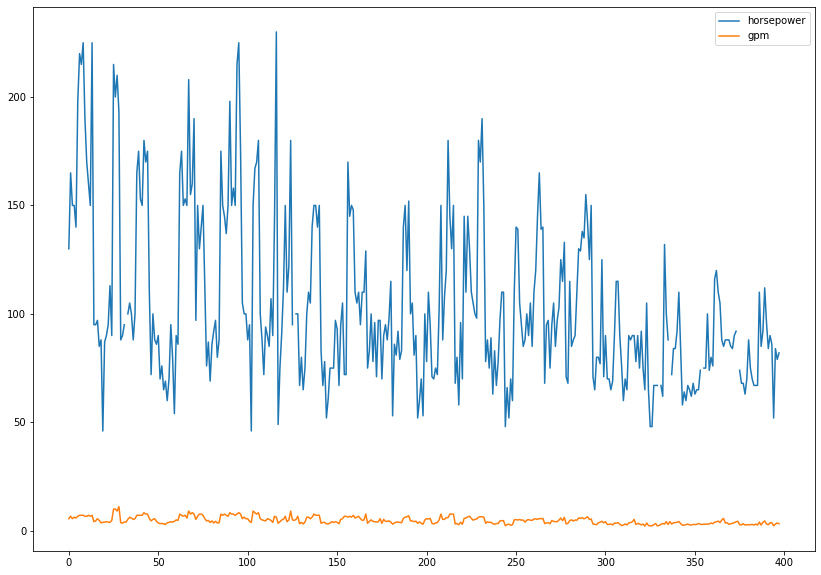
cars['gpm_z'] = round((cars.gpm - cars.gpm.mean()) / cars.gpm.std(), 2)
cars['horsepower_z'] = round((cars.horsepower - cars.horsepower.mean()) / cars.horsepower.std(), 2)
cars.head()
'''
horsepower model_year origin gpm manufacturer continent weight_cat gpm_z horsepower_z
0 130.0 1970 usa 5.56 chevrolet north_america medium 0.48 0.66
1 165.0 1970 usa 6.67 buick north_america heavy 1.15 1.57
2 150.0 1970 usa 5.56 plymouth north_america medium 0.48 1.18
3 150.0 1970 usa 6.25 amc north_america medium 0.89 1.18
4 140.0 1970 usa 5.88 ford north_america medium 0.67 0.92
'''cars.loc[:, ['horsepower_z', 'gpm_z']].plot(figsize = (14,10))
plt.show()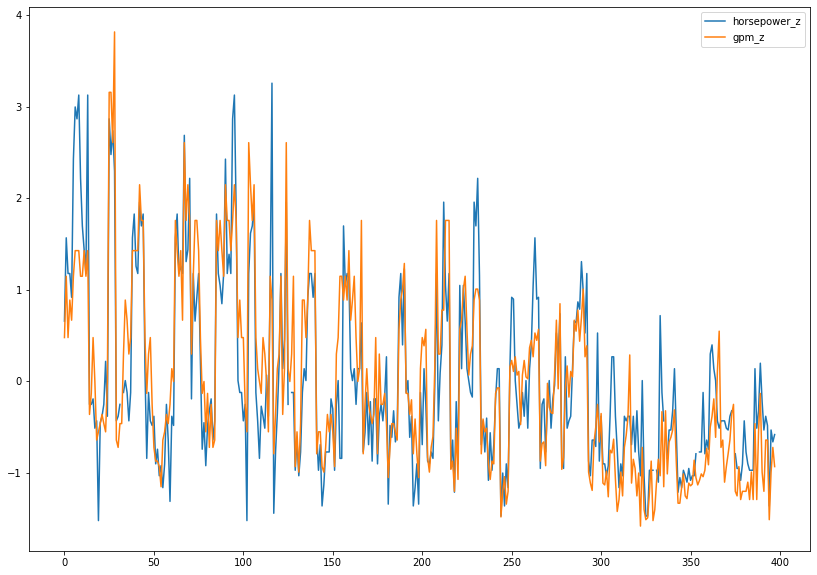
# 문제7 Transform the columns model_year and origin into (k-1) columns with dummy variables!
# 이 문제도 뭔소린지 이해가 안간다.
# model_year와 origin컬럼을
# k-1 컬럼에 dummy variables를 이용해서 넣어라?
# 다른건 다 그렇다 치고 k-1 컬럼은 뭐냐..
cars.head()

'''

horsepower	model_year	origin	gpm	manufacturer	continent	weight_cat	gpm_z	horsepower_z
0	130.0	1970	usa	5.56	chevrolet	north_america	medium	0.48	0.66
1	165.0	1970	usa	6.67	buick	north_america	heavy	1.15	1.57
2	150.0	1970	usa	5.56	plymouth	north_america	medium	0.48	1.18
3	150.0	1970	usa	6.25	amc	north_america	medium	0.89	1.18
4	140.0	1970	usa	5.88	ford	north_america	medium	0.67	0.92
'''pd.get_dummies(cars, columns = ['model_year', 'origin'], drop_first = True)
# get_dummies라는 함수의 기능은 인지를 하지 못하고 있었는데
# 뒤에 입력해오는 컬럼의 필드값을 전체적으로 무언가의 연산을 해주는 것 같다.cars = pd.get_dummies(cars, columns = ['model_year', 'origin'],drop_first = True)300x250
'개발일지 > 임시카테고리' 카테고리의 다른 글
| pandas 판다스 기초 23 replace 응용 중요 루틴 및 dropna등 데이터 클리닝 여태까지 배운것 활용 (0) | 2022.08.19 |
|---|---|
| pandas 판다스 기초 22 seaborn 시각화 그래프 (0) | 2022.08.19 |
| SQL 기초2 기본문법 사용 순서 및 PostgreSQL 리뷰 (0) | 2022.08.19 |
| (해결)과제 1 postgresql 슬로우 쿼리 해결방법 찾기 (0) | 2022.08.18 |
| SQL 기초 1 DISTINCT, COUNT (0) | 2022.08.18 |
